
03 · The Complete Catalog of Option Combinations: Classified by Risk-Return Type
There are thousands of option strategies, but fewer than 20 are truly worth mastering. This article sorts them into four classes by "what money you're earning": directional strategies, volatility strategies, income strategies, and hedging strategies.
Each strategy comes with [Construction], [Payoff shape (ASCII chart)], [Expiration P/L formula], [Breakeven numeric example], [Suitable conditions], and [Risks]. How to read: study the payoff diagram first, then ask what kind of person would buy that shape.
Strategy Overview
| Class | What It Earns | Representative Strategies | Payoff Shape | Biggest Risk |
|---|---|---|---|---|
| ① Directional | Price moving somewhere | Long Call/Put, bull/bear spreads, ratio spreads | Win if direction lands | Lose if direction fails (capped for spread types) |
| ② Volatility | Movement expanding or shrinking | Straddle, strangle, iron condor, iron butterfly, calendar, diagonal | Volatility decides P/L | Buyers bleed Theta; sellers bleed Gamma |
| ③ Income | Selling time/premium | Covered call, cash-secured put, collar, synthetic stock | Premium-capped/enhanced | Missed rallies or forced stock purchases |
| ④ Hedging | Insuring existing positions | Protective put, index put hedge, tail hedge | Losses floored | Insurance too costly or failing |
One-line summary: directional strategies bet "which way," volatility strategies bet "how far," income strategies bet "not far," and hedging strategies fear "far."
One Line for the Four Classes
Directional strategies bet on which way; volatility strategies bet on how far; income strategies bet it won't go far; hedging strategies fear it will. Before picking any strategy, be clear about which class of money you're chasing — pick the wrong class, and even the most elegant payoff curve is just catching falling knives.
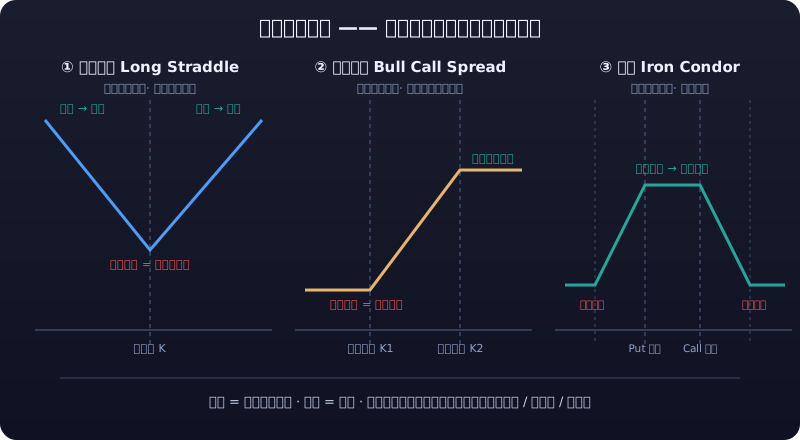
1. Directional Strategies: Betting Where Price Goes
1.1 Long Call / Long Put (Naked Buy)
[Construction] Buy one call or put. [Payoff shape]
Long Call (cost C)
Profit
 │              ╱
 │            ╱
 │          ╱
 0 ────────╱──────────────
 │   ╱──────────────────▶ Underlying price
 │ ─────────────────────    loss zone (shifted down by C)
Loss
[Expiration P/L formula] P/L = max(S − K, 0) − C (Call); P/L = max(K − S, 0) − P (Put) [Breakeven point] Call: K + C; Put: K − P [Numeric example] Spot 100; buy the strike price-100 Call for premium 4: breakeven = 104; at expiry S=105 → profit 1; at expiry S=102 → lose 2 (right direction, but not past breakeven) [Suitable conditions] Strong conviction bullish/bearish AND large expected movement (otherwise Theta grinds you down) [Risks] Lose the entire premium; right direction but too slow still loses
1.2 Bull Spread (Bull Call Spread Example)
[Construction] Buy the lower-strike Call + sell the higher-strike Call (same expiry). [Payoff shape]
Profit
   M │              ┌──────────────
     │            ╱
     │          ╱
   0 ─────────╱──────────────────
     │   ╱──────────
     │ ╱             loss zone (shifted down by net cost)
  Loss
[Expiration P/L formula] P/L = max(S−K1,0) − max(S−K2,0) − net cost (K1<K2, net cost = C1−C2) [Breakeven point] K1 + net cost [Numeric example] Buy 100 Call @6, sell 110 Call @2 → net cost 4: breakeven 104; max profit = (110−100) − 4 = 6; max loss = 4; at expiry S=115 → profit 6 (capped) [Suitable conditions] Moderately bullish; want to cut cost and cap downside [Risks] No extra gain once price exceeds the upper bound (profit capped)
1.3 Bear Spread (Bear Put Spread Example)
[Construction] Buy the higher-strike Put + sell the lower-strike Put (same expiry). [Payoff shape]
Profit
   M │  ┌────────────────
     │    ╲
     │      ╲
   0 ────────╲────────────────────
     │       ────────
  Loss        ╲(shifted down by net cost)
[Expiration P/L formula] P/L = max(K2−S,0) − max(K1−S,0) − net cost (K1<K2, net cost = P2−P1) [Breakeven point] K2 − net cost [Numeric example] Buy 100 Put @6, sell 90 Put @2 → net cost 4: breakeven 96; max profit = (100−90) − 4 = 6; max loss = 4 [Suitable conditions] Moderately bearish [Risks] No extra gain once price falls below the lower bound
1.4 Ratio Spread (Call Ratio Example)
[Construction] Buy 1 lower-strike Call + sell 2 higher-strike Calls. [Payoff shape]
Profit
   8 │               ┌───────────
     │             ╱ │
     │           ╱   │
   0 ──────────╱─────│───────────────
     │     ╱─────────│────────╱
     │   ╱           │       ╱      ← unlimited losses to the right
  Loss ╱             │     ╱
[Expiration P/L formula] P/L = max(S−K1,0) − 2×max(S−K2,0) − net cost (buy 1, sell 2) [Breakeven points] Two: near K1 + net cost, and on the right near K2 + (K2 − K1) − net cost (verify with the numbers below) [Numeric example] Buy 100 Call @6, sell two 110 Calls @2×2=4 → net cost 2: at expiry S=110 → max profit = (110−100) − 2 = 8; at expiry S=120 → P/L = 20 − 20 − 2 = −2 (right side turns into losses) [Suitable conditions] Expect moderate gains but firmly do NOT believe in a blow-off top (strong conviction about an upper range) [Risks] The second sold Call creates unlimited risk on the upside — a big rally means uncapped losses; beginners beware
2. Volatility Strategies: Betting on Movement Size
2.1 Long Straddle
[Construction] Buy a Call and a Put at the same strike. [Payoff shape]
Profit
     │              ╱╲
     │            ╱  ╲
   0 ───────────╱────╲──────────────
     │        ╱      ╲
     │      ╱          ╲
  Loss │    ──────────────         ← max loss = total premium
      └───────────────────────────▶
          K−C−P   K   K+C+P
[Expiration P/L formula] P/L = |S − K| − (C + P) [Breakeven points] K − (C+P) and K + (C+P) [Numeric example] Buy 100 Call @6 + buy 100 Put @4 → total cost 10: breakevens 90 / 110; at expiry S=115 → profit 5; at expiry S=100 (no move at all) → lose all 10 [Suitable conditions] Big movement expected but direction unknown (before earnings, major events) [Risks] ① Movement too small — both legs bleed premium; ② post-event IV Crush — "right on direction yet underpaid"
2.2 Short Straddle
[Construction] Sell a Call and a Put at the same strike. [Payoff shape]
Profit
     │     ┌─────────────┐
     │   ╱               ╲
   0 ──╱──────────────────╲──────────
     │ ╱                    ╲
  Loss ╱                      ╲      ← unlimited losses at both ends
      └───────────────────────────▶
          K−C−P   K   K+C+P
[Expiration P/L formula] P/L = (C + P) − |S − K| [Breakeven points] K − (C+P) and K + (C+P) [Numeric example] Sell 100 Call collecting 6 + sell 100 Put collecting 4 → income 10: max profit 10 (at expiry S=100); breakevens 90 / 110; at expiry S=115 → lose 5 [Suitable conditions] High IV but expecting calm to return (after events land, after panics) [Risks] Unlimited risk at both ends: one black swan (up or down) can blow through it all — the iron condor/butterfly exist precisely to add guardrails on those ends
2.3 Long Strangle
[Construction] Buy an OTM Call + an OTM Put (different strikes). [Payoff shape] Same silhouette as the long straddle but wider-bottomed and cheaper.
Profit
     │                 ╱╲
     │               ╱  ╲
   0 ───────────────╱────╲────────────
     │             ╱      ╲
  Loss │         ────────────
      └───────────────────────────▶
         K1−(C+P) K1    K2  K2+(C+P)
[Expiration P/L formula] P/L = max(K1−S,0) + max(S−K2,0) − (C+P) [Breakeven points] K1 − (C+P) and K2 + (C+P) [Numeric example] Buy 95 Put @2 + buy 105 Call @3 → cost 5: breakevens 90 / 110; at expiry S=100 → lose 5; at expiry S=112 → profit 7 − 5 = 2 [Suitable conditions] Expecting enormous movement (even more extreme than the straddle); cheaper cost to bet on a huge breakout [Risks] Requires even more movement than a straddle to break even (further OTM, harder to recoup)
2.4 Iron Condor
[Construction] Sell an OTM Put + buy a further-OTM Put (lower guardrail); sell an OTM Call + buy a further-OTM Call (upper guardrail). Four legs, same expiry. [Payoff shape]
Profit
  C │        ┌────────────┐
    │      ╱                ╲
  0 ─────╱────────────────────╲────────
    │   ╱                      ╲
 Loss │╱                        ╲      ← capped losses at both ends
    └─────────────────────────────────▶
      K1  K2     range     K3   K4
[Expiration P/L formula] P/L = net premium collected − shortfall paid if breached (losses capped on each end) [Breakeven points] Lower: K2 + net income; upper: K3 − net income [Numeric example] Sell 90 Put @2 / buy 85 Put @1; sell 110 Call @2 / buy 115 Call @1 → net income = 1 + 1 = 2: max profit 2 (expiry between 90–110); max loss = (90−85) − 1 + (115−110) − 1 = 3; breakevens 92 / 108 [Suitable conditions] High IV with an expected range-bound market (implied volatility is expensive while the underlying has no direction) [Risks] Breaching either wing's guardrail → losses (capped, but potentially several times the net income); four legs mean heavy commissions
2.5 Iron Butterfly
[Construction] Sell ATM Call + buy further-OTM Call; sell ATM Put + buy further-OTM Put. Four legs, same expiry. [Payoff shape]
Profit
  C │            ┌────┐
    │          ╱        ╲
  0 ─────────╱────────────╲───────────
    │       ╱              ╲
 Loss │     ╱                ╲        ← capped losses at both ends
    └───────────────────────────────▶
      K−W   K        K      K+W
[Expiration P/L formula] Same as iron condor: P/L = net income − losses beyond the range (each side capped separately) [Breakeven points] K − net income and K + net income [Numeric example] Sell 100 Call @4 / buy 110 Call @1; sell 100 Put @4 / buy 90 Put @1 → net income = 3 + 3 = 6: max profit 6 (at expiry S=100); max loss = 10 − 6 = 4; breakevens 94 / 106 [Suitable conditions] A tighter range view than the condor; high IV + expectation of strict sideways drift [Risks] Same as the condor: losses beyond the range are capped; but the profitable zone is narrower than the condor's
2.6 Calendar Spread
[Construction] Buy the back-month Call + sell the front-month Call at the same strike. [Payoff shape] (illustrative: horizontal axis = underlying price at front-month expiry, vertical axis = P/L)
Profit
     │             ╱╲
     │           ╱    ╲
   0 ──────────╱───────╲──────────────
     │        ╱         ╲
     │      ╱             ╲
  Loss │    ──────────────────       ← loses if S is far from K when the front month expires
      └───────────────────────────▶
[Expiration P/L formula] (at front-month expiry) P/L = back-month residual value − (front-month premium − back-month premium) — approximately maximal near K [Breakeven points] Approximately near both sides of K; must be computed from the live chain [Numeric example] Spot 100: sell the 7-day 100 Call @3, buy the 30-day 100 Call @6 → net cost 3: after 7 days the stock is still near 100 → front month expires worthless, back month retains ≈ 4 → profit ≈ 1; if after 7 days the stock has surged to 115 → front month loses and the back month can't make up for it → loss [Suitable conditions] Short-term calm, longer-term rise expected (sell front-month time value, betting the back month won't blow out early) [Risks] If the underlying moves big too soon → the front month bleeds hard before the back month catches up; requires the relative volatility relationship to hold
2.7 Diagonal Spread
[Construction] Buy the back-month lower-strike Call + sell the front-month higher-strike Call (differing in both strike and time). [Payoff shape] Between calendar and bull spreads — mildly bullish with income.
Profit
     │             ╱────
     │           ╱
   0 ──────────╱───────────────
     │        ╱
     │      ╱
  Loss │    ╱
      └────────────────────────▶
[Expiration P/L formula] No single closed form; compute from the back-month residual value at front-month expiry [Numeric example] Spot 100: buy the 30-day 95 Call @8, sell the 7-day 105 Call @2 → net cost 6: after 7 days the stock is at 100 → front month worthless, back month retains ≈ 6 → about break-even; stock at 103 → front month worthless, back month worth more → small gain [Suitable conditions] Moderately bullish + selling short-term time value (a diagonal call = income-oriented bullishness) [Risks] Similar to calendar spreads plus a directional bet; computationally complex — better suited to advanced traders
3. Income Strategies: Earning Premium From Holdings
3.1 Covered Call
[Construction] Hold 100 shares + sell 1 Call. [Payoff shape]
Profit
   8 │               ┌──────────
     │             ╱
     │           ╱
   0 ──────────╱────────────────────
     │       ╱          ← profit capped
  Loss │     ╱
     │   ╱
      └───────────────────────────▶
         97   100     105
[Expiration P/L formula] P/L = (S − 100) + C income, but once S exceeds K it caps at (K − 100) + C [Breakeven point] 100 − C (premium 3 → 97) [Numeric example] Buy 100 shares at 100, sell the 105 Call @3: breakeven 97; at expiry S=110 → assigned, profit capped = (105−100) + 3 = 8; at expiry S=95 → P/L = (95−100) + 3 = −2 [Suitable conditions] Already holding the stock + judging it will drift sideways or inch up (enhance returns with premium) [Risks] Missing the rally: gains capped in a surge, missing the main leg; no downside protection (the premium only cushions slightly)
3.2 Cash-Secured Put
[Construction] Reserve cash in the account + sell 1 Put (cash ready below the strike to take delivery). [Payoff shape]
Profit
   3 │   ┌───────────────────
     │ ╱
   0 ─╱───────────────────────────
     │╱
  Loss│╱
      └─────────────────────────▶
        92   95    100
[Expiration P/L formula] P/L = P income − max(K − S, 0) [Breakeven point] K − P (e.g., 95 − 3 = 92) [Numeric example] Spot 100; sell the 95 Put @3 (cash of 95×100 reserved): at expiry S ≥ 95 → earn 3; at expiry S=90 → forced to take shares at 95, effective cost 92 (a further slide means losing more) [Suitable conditions] Wanting to buy the stock below current price (a paid-to-wait substitute for limit orders) [Risks] A crash far below the strike → forced to catch a falling knife at a high effective price; without cash backing you'd need margin, upgrading the risk
3.3 Collar
[Construction] Hold the stock + buy a protective Put + sell a covered Call (premiums roughly cancel). [Payoff shape]
Profit
  +5 │            ┌───────────
     │          ╱
   0 ─────────╱────────────────────
     │        ╱
  −5 │      ╱
     │    ╱
      └───────────────────────────▶
        95      100     105
[Expiration P/L formula] P/L = (S − 100) + (P income − C expense), sandwiched within [−max loss, +max profit] [Breakeven point] 100 + (C income − P expense) (100 if they cancel) [Numeric example] Spot 100: buy the 95 Put @2 + sell the 105 Call @2 → zero-cost collar: max loss = 100 − 95 = 5 (floored); max profit = 105 − 100 = 5 (capped); breakeven = 100 [Suitable conditions] Holding stock but worried about a sharp drop, unwilling to pay net insurance cost (use the sold Call's premium to offset the bought Put's) [Risks] Profit capped (forgoing surges); if Puts are pricier than Calls, net insurance cost remains
3.4 Synthetic Long Stock
[Construction] Buy a Call + sell a Put at the same strike and expiry (net cost ≈ spot − strike present value). [Payoff shape] Nearly identical to holding the stock:
Profit
     │           ╱
     │         ╱
   0 ────────╱─────────────────
     │     ╱
     │   ╱
  Loss │ ╱                    ← unlimited losses below (short-Put risk)
      └────────────────────────▶
[Expiration P/L formula] P/L ≈ S − strike cost (linear, uncapped both ways) [Breakeven point] K + (C − P) (approximately equal to the purchase price) [Numeric example] Spot 100: buy 100 Call @6 + sell 100 Put @4 → net cost 2, effective basis 102: at expiry S=110 → profit 8; at expiry S=90 → lose 12 [Suitable conditions] Wanting "stock-like P/L" without tying up equivalent capital, or optimizing taxes/leverage via option structures [Risks] Downside is as bottomless as owning the stock, plus margin usage from the short Put — this is not "free stock"; it's leveraged ownership
4. Hedging Strategies: Paying for Insurance
4.1 Protective Put
[Construction] Hold the stock + buy a slightly lower-strike (or ATM) Put. [Payoff shape]
Profit
     │            ╱
     │          ╱
   0 ─────────╱────────────────────
     │        ╱
  −7 │      ╱                     ← floored below
     │    ╱
      └───────────────────────────▶
        93  95       102
[Expiration P/L formula] P/L = (S − 100) + max(K − S, 0) − P cost [Breakeven point] 100 + P (e.g., 100 + 2 = 102) [Numeric example] Spot 100; buy the 95 Put @2: max loss = (100 − 95) + 2 = 7 (floored); at expiry S=115 → profit 15 − 2 = 13; at expiry S=90 → lose 7 (instead of 10) [Suitable conditions] Holding stock + clear worry about a major decline (before events, before trend breaks) [Risks] Insurance costs money — repeated buying over time significantly erodes returns; if no decline materializes, premium is wasted
4.2 Index Put Portfolio Hedge
[Construction] Hold a stock/fund portfolio + buy index Puts (hedge the whole book with SPY/CSI 300 etc. index options). [Payoff shape] Same as the protective put, but on the index, covering the entire portfolio.
| Point | Notes |
|---|---|
| What is hedged | The portfolio's systematic risk (broad-market declines) — not single-stock risk |
| Strike selection | Often OTM 5–10% (cheap-ish but covers "medium disasters") |
| Dynamic adjustment | Market up → index IV low, Puts cheap, add insurance; market down → Puts dear, consider partial profit-taking |
| Cost management | Offset insurance cost with covered-call income (i.e., the collar structure) |
[Numeric example] Holding a $1M US-stock portfolio, buying SPY puts 5% OTM costing $15k/year: a 20% market drop yields roughly $150k of Put gains, compressing the portfolio drawdown from −20% to about −6% [Suitable conditions] Long-term holdings + periodic defense (stretched valuations, choppy highs) [Risks] Hedge cost drains continuously; if the crash is only single-stock level (your portfolio doesn't follow), the insurance is wasted
4.3 Tail-Risk Hedge
[Construction] Persistently buy deep-OTM, long-dated index Puts (e.g., 15–30% OTM, 6–12 months to expiry) as "catastrophe insurance" for the portfolio. [Payoff shape]
Profit
     │                              ╱
     │                            ╱
   0 ──────────────────────────╱──────
     │                     ╱
  Loss │ ────────────────────          ← steady small losses in normal times
      └───────────────────────────▶
        (huge payoff erupts here if disaster strikes)
[Expiration P/L formula] P/L = deep-OTM long-dated Put expiration value − cumulative purchase cost (small steady losses normally; windfall in catastrophe) [Breakeven point] Reached only in a true crash (index −25% or worse); almost guaranteed losses otherwise [Numeric example] Spend 0.5–1% of the portfolio per year on SPX puts 20% OTM, several months out: in a March-2020-style −34% plunge, such insurance can cover several years' worth of premiums in one stroke [Suitable conditions] Fully invested long-term holders bracing for black swans (2020/2008 grade) [Risks] ① Constant bleeding in normal times (0.5–1%/year drag); ② the crash may be a slow grind rather than a sudden plunge, leaving deep-OTM Puts still worthless; ③ you must afford it and hold it
5. Strategy-to-Market-Environment Matching Table
💡 How to Use the Matching Table
First diagnose your current market environment, then pick the strategy. Misread the environment and even the best strategy becomes knife-catching.
| Environment | Traits | Matching Strategies | Avoid |
|---|---|---|---|
| Clear trend (one-way up/down) | Moving averages aligned, IV lifting | Long Call/Put, bull/bear spreads, diagonal spreads | Selling strategies (short straddles/condors get run over by trends) |
| Range-bound | Clear boundaries, no direction | Iron condor, iron butterfly, calendars, covered calls, short straddle | Naked buys (Theta grinds daily) |
| Low volatility (IV at historical lows) | Calm market, cheap options | Buying strategies: long straddles/strangles, long Call/Put, ratio spreads | Selling options (premium too thin to matter) |
| High volatility (post-panic/post-event) | High IV, extreme sentiment | Selling strategies: short straddles/condors/short Puts, covered calls (fat premium) | Buying (buying at IV peaks invites the Crush double kill) |
| Pre-event (earnings/FOMC/data) | Options pricing imminent moves | Long straddles/strangles (betting on unknown-direction movement) | Naked short straddles (unknown event direction, Gamma hits both ways) |
| Holding positions, fearing a crash | Long-term holdings | Protective put, collar, index put hedge | Naked short Calls (worst case: assignment into a surge) |
💡 Environment–Strategy Mnemonic
Trend: trade direction. Range: trade the seller's side. Low vol: trade the buyer's side. High vol: trade the seller's side. Pre-event: buy straddles. Holding: wear a collar. Each rule's enemy is its opposite environment — environment diagnosis comes first.
The Iron Rule of Strategy Selection
Environment diagnosis comes first. Trend: direction. Range: sell. Low vol: buy. High vol: sell — each strategy's enemy is its opposite environment; misdiagnose, and even the best strategy is catching knives.
Risk Warning
⚠️ Risk Warning
Every strategy in this article has a "pretty payoff picture" — but always remember:
① Sellers carry tail risk: short straddles, naked short Calls/Puts, condors, butterflies, covered calls, cash-secured puts — all seller strategies cap their gains, yet a single black swan can wipe out months of premiums. In March 2020, the GameStop squeeze of 2021, and the VIX spike of 2018, countless naked-short and short-straddle books blew up within days. Selling options = selling insurance; whoever sells insurance pays catastrophe claims.② The win-rate asymmetry trap: seller strategies show "high win rate, small wins each time"; buyer strategies show "low win rate, occasional big wins." Don't stare only at win rates — look at expectancy — and never scale up beyond tolerance because "20 sells have all worked." ③ Execution risk of complex strategies: calendars/diagonals/ratio spreads demand precise reads on IV and time; half-understanding them just donates commissions to brokers. Four-leg strategies stack fees, spreads, and slippage — real results usually lag paper ones. ④ All premiums and breakevens here are fictional teaching numbers. Real quotes, margins, fees, and contract specs always defer to each exchange's and broker's live data.
This article is not investment advice. Beginners should start with "directional spreads + protective puts"; leave selling and multi-leg complexity until systematic trade review is in place.
Summary
- Directional strategies (naked buys/spreads/ratios) bet on "which way"; spreads cap profits in exchange for lower cost and risk
- Volatility strategies (straddles/condors/calendars etc.) bet on "how far"; buyers own Vega+Gamma and pay Theta, sellers sell Vega+Gamma and collect Theta
- Income strategies (covered calls/cash-secured puts/collars) earn premium from holdings; collars use sold Calls to subsidize bought Puts' insurance cost
- Hedging strategies (protective puts/index hedges/tail hedges) insure the portfolio; insurance always costs, but saves lives in catastrophes
- Diagnose environment before choosing strategy: trend → direction; range → sell; low vol → buy; high vol → sell; pre-event → straddles; holding → collar