
03 · Range Markets and Grid Trading in Practice
The nightmare of trend traders is the range; so is the paradise of range traders. Grid trading (Grid Trading) is the most classic "mechanical" play in a range market: no need to predict direction — just admit "I don't know where price will go, but I know it will likely bounce back and forth within a band" — then slice the band into grids and buy low, sell high.
But grids have one fatal mathematical weakness: they always lose in a one-sided market. This article dissects the principle, parameters, mathematical expectation, variants, and ways to die in one pass — so before using one, you know exactly what contract you are signing.
1. What Is a Range Market: Identify First, Act Later
1.1 Identifying traits (three rulers)
| Trait | Concrete sign | Reading |
|---|---|---|
| Flat moving averages | MA20 and MA60 near horizontal, repeatedly tangled | No clear direction |
| Bollinger squeeze | BOLL bandwidth narrowing, price bouncing inside the bands | Volatility compression |
| Clear highs/lows | A clean upper/lower boundary can be drawn and price touches it repeatedly | There is an edge to trade |
Supporting confirmations (historical statistics; defer to actual conditions):
- ADX < 20-25: insufficient trend strength;
- The oscillation has persisted for over a week with the boundaries tested multiple times;
- Volume shrinking (low-volume sideways), and breakout volume is also inadequate.
1.2 The two fates of a range
- Range continues: price keeps bouncing inside the band — grids/range scalping make money;
- Range breaks: price eventually picks a direction — this is where every range strategy's reverse risk lives.
Key insight: a range market is only confirmed "after the fact". What you think is a range can turn into a trend at any moment. Every range strategy must reserve a "breakout contingency plan" (see Part 6) — otherwise ten months of profit can be wiped out in one month.
2. Overview of Range Strategies
| Strategy | Technique | Expected return source | Main risk |
|---|---|---|---|
| Manual range scalping | Sell at the upper edge, buy at the lower edge | Spread on each round trip | One-sided move after breakout |
| Range trading (semi-auto) | Orders placed at fixed support/resistance | Same, but rule-based | Range invalidated |
| Grid trading (automated) | Split into N cells, automatic buy-low sell-high | Spread per filled cell × cell count | Fully positioned and trapped in a one-sided market |
| Straddle/options (advanced) | Buy both ends of volatility | Breakout moves | Time value decay |
This article focuses on grids: they are the only way to execute range logic fully automatically, and also where retail traders most easily fall for "bot sales pitches".
3. Grid Trading, Fully Dissected
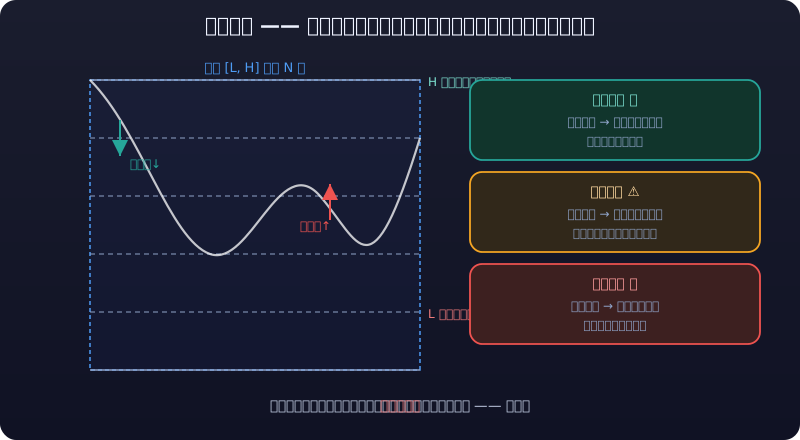
3.1 Principle and four parameters
Principle: evenly divide the price band [lower bound L, upper bound H] into N cells. Each time price falls one cell, buy one lot; each time it rises one cell, sell one lot. Each completed "buy+sell" pair earns one cell of spread. No directional judgment needed — only range judgment.
| Parameter | Definition | How to set it (example) |
|---|---|---|
| Lower bound L / Upper bound H | Grid edges | Use recent 1-2 month support/resistance; leave a buffer (±5% beyond bounds recommended) |
| Grid count N | How many cells to slice the band into | Wider band → more cells; crypto commonly 50-150 cells, narrow bands 10-30 |
| Per-cell capital | Amount bought per cell | Total capital ÷ estimated max fillable cells (see 3.3) |
| Total capital allocation | Overall grid investment | No more than half of total capital, leaving the other half for the "breakout plan" and life |
3.2 The grid's mathematical expectation: why one-sided markets lose
Use a simplified example (fees excluded):
- Band [80, 120], split into 5 cells of size 8, 100 CNY per cell;
- Each completed pair earns 8 CNY (one cell of spread);
- Range case: price bounces 10 times within the band; each pass fills several pairs, netting several cells of spread;
- One-sided up: price runs from 80 straight to 150. After building, the grid only sells and never buys again — it sells as it rises, going completely flat above 120; whatever happens beyond is none of your business. Worse: if you re-open a new grid at the highs, that becomes chasing.
- One-sided down: price falls from 120 straight to 50. The grid keeps buying — the more it falls, the more it buys, until all capital is spent — floating losses compound with every leg down. This is the mathematical source of "grids get fully positioned and trapped in one-sided markets".
| Market | Grid return | Why |
|---|---|---|
| Range oscillation | Positive (spread per pair) | Buy-low sell-high triggered repeatedly |
| One-sided up | Only part of the bottom, then flat | Sold out with no chance to buy back |
| One-sided down | Loss (floating loss while fully positioned) | Buys all the way down, digging deeper |
The expectation in one sentence: a grid earns money from "round trips" and loses money on "one-way trips". More oscillations = more profit; stronger trends = harder losses. It is essentially a strategy that shorts volatility — and when volatility is released one-sidedly, shorting volatility bites back.
3.3 The correct per-cell capital calculation (important)
A grid's biggest risk is "capital exhausted after price breaks below L". Full-grid capital = per-cell capital × maximum fillable cells. Always assume the extreme case:
Example: total available capital 100k CNY, willing to commit at most 60% (60k) to the grid
Band [80, 120], stop-loss possible at 60 (depth 40, cell size 4, max 10 cells)
Per-cell capital = 60k ÷ 10 cells = 6,000 CNY/cell- Reserve beyond the boundary: keep separate funds for "catching falling knives" below L, with a clear stop-loss line (5%-10% below L triggers a full stop or pause);
- A grid should never run fully invested — full deployment means no room to recover when the range judgment is wrong.
3.4 Markets grids suit vs don't suit
| Suited | Not suited |
|---|---|
| Long-lasting narrow ranges with clear boundaries | One-sided trends (up or down) |
| Stable volatility, no major events | Around earnings/macro data/major policy |
| Major instruments (good liquidity, low slippage) | Small-cap coins/illiquid contracts (one wick kills) |
| Spot or low leverage (can hold long term) | High-leverage futures grids (a drop means liquidation — win spreads, lose principal) |
3.5 Estimating grid returns (numeric walkthrough)
Grid returns = filled pairs × return per pair, and filled pairs depend on how often price bounces — the least certain variable. Compute the per-pair return first:
Example: band [100, 120], split into 10 cells of size 2, 5,000 CNY per cell
Return per pair = per-cell amount × cell spread% = 5000 × (2 ÷ 100) = 100 CNY/pair
Total grid capital = 10 × 5000 = 50,000 CNY
Annualized estimates by "pairs filled per day" (250 trading days; historical common levels, not predictions):
| Pairs per day | Daily return | Annual return | Annualized (on 50k grid capital) |
|---|---|---|---|
| 0.5 pairs (one pair every two days) | 50 CNY | 12,500 CNY | 25% |
| 1 pair | 100 CNY | 25,000 CNY | 50% |
| 2 pairs | 200 CNY | 50,000 CNY | 100% |
Real-world caveats: ① the 100% annualized figure looks tempting, but filled pairs are highly unstable in real markets — fewer oscillations can mean zero fills for weeks; ② fees are not deducted above — denser grids mean a higher fee share; ③ in one-sided markets this entire estimate collapses — returns go negative. Recalculate any grid software's advertised "XX% annualized" yourself under this framework and ask one question: how many times a day does its assumption assume price crosses back and forth?
4. Grid Variants: Spot Grid / Futures Grid / Fund Grid
| Variant | Play | Risk profile | Notes |
|---|---|---|---|
| Crypto spot grid | Grid bots on Binance/OKX etc.; spot auto buy-low sell-high | No liquidation risk, but drawdown/trap risk | Most popular, best for beginners |
| Futures grid (coin-margined/USDT-margined) | Leveraged grid, more aggressive per-cell entries | Leverage + decline = liquidation risk; wick moves can trigger forced liquidation outright | Leverage ≤ 2-3x, only on low-volatility instruments |
| Fund grid | DCA-style grid with OTC funds (e.g. add a tranche for every 5% NAV drop) | Low trade frequency, relatively high fees | The "lazy person's grid", for those who won't watch markets |
| Manual grid | Alternate orders yourself at support/resistance | Saves fees, flexible | Requires discipline: order at price, follow the plan |
Platform capability quick reference (defer to real-time platform features):
- Top crypto exchanges (Binance, OKX, Bybit, etc.) all have built-in spot/futures grid bots with high parametrization;
- Domestic futures can approximate grids via conditional orders through some brokers/third-party software (confirm compliance first);
- Stocks/ETFs offer conditional orders or broker smart-order (grid) features — note A-share T+1: shares bought today cannot be sold today, which limits grid frequency.
Whichever platform: test small through one complete cycle first (at least 2-4 weeks), confirm parameters and platform rules (minimum order size, fees, grid trigger mode) before committing real capital.
5. Range Trading (Manual Buy-Low Sell-High)
5.1 How to do it
- Draw the band: use obvious recent 1-2 month support/resistance (prior highs/lows, high-volume congestion);
- Act only near the edges: price hits the upper edge with stalling momentum → sell/short; hits the lower edge and stabilizes → buy/long;
- Stop-loss: exit when the range breaks (upper edge broken on a closing basis with volume = the short thesis fails); don't trade mid-band (far from both edges, poor risk-reward);
- Require risk-reward ≥ 2:1 per trade (edge-to-midpoint distance is the stop, edge-to-opposite-edge distance is the target).
💀 Breaking the lower bound means the range failed — stop buying
Below the lower bound = the range has failed. Stop buying. Manually continuing to buy below L "because it's cheap" is catching falling knives outside the range — adding cells is adding fuel to the fire. Never run grid capital fully invested; keep the other half for the "breakout plan" and life.
5.2 Difference from grids
| Dimension | Range trading | Grid |
|---|---|---|
| Execution | Manual, watching, waiting for triggers | Automatic, mechanical, around the clock |
| Trade frequency | Low (only at edges) | High (every cell triggers) |
| Discipline needed | Yes (control your hands) | Yes (control restarting/re-parameterizing) |
| When range judgment is wrong | Fast stop, limited loss | You notice after being trapped, large floating loss |
| Suited to | Those with time to watch | Those without time to watch |
6. Spotting Range-to-Trend Transitions: The Discipline of Pulling Grids on Breakouts
The most dangerous moment for any range strategy is when the range starts failing. Three rules for pulling a grid:
| Signal | Action |
|---|---|
| Upper edge broken on volume at close | Immediately pause/remove the grid; do not "wait for the retest to re-hang" — never predict retests on breakout day |
| Lower edge broken on volume | Pause the grid immediately and assess: break < 5% → switch to watch mode; > 5% → exit per the preset stop-loss |
| MAs start fanning out + ADX rising fast | The range premise has failed, the grid thesis no longer holds — pull it first, ask questions later |
Decision flow:
Price breaks the range boundary
   ↓
Check volume: heavy-volume breakout → likely trend (pull the grid)
             low-volume false breakout → may return to range (may continue, but reduce grid capital)
   ↓
Check post-breakout behavior: 3 daily closes holding outside the range → confirmed trend,
switch the grid to a trend strategy or disable it
Core discipline: prefer pulling the grid on breakout and re-entering after confirmation over "betting it's a fake breakout" and letting the grid eat trend losses. Pulling costs you "the gains if price returns to the range"; keeping it costs you "the full floating loss of a one-sided move" — these are asymmetric bets.
⚠️ On breakout, prefer pulling first and confirming later — don't bet on a fake breakout
On breakout, prefer pulling first and re-entering after confirmation, rather than "betting it's a fake breakout" and letting the grid eat trend losses. Pulling costs you "the gains if price returns to the range"; keeping it costs you "the full floating loss of a one-sided move" — an asymmetric bet, and pulling sits on the better side of it.
💀 Grids earn round trips and lose one-way trips
A grid earns money from "round trips" and loses money on "one-way trips". More oscillations = more profit; stronger trends = harder losses — it essentially shorts volatility, and when volatility is released one-sidedly, shorting volatility bites back. One-sided markets always lose; recalculate any grid software's advertised "XX% annualized" yourself under this framework.
7. Ways Grids Die: Checklist
| Death | Script | Antidote |
|---|---|---|
| Fully positioned in a one-sided market | Grid buys all the way down, capital exhausted, floating loss 30%+ | Commit only half of total capital + stop-loss line beyond the boundary |
| Catching falling knives below L | Buying below the lower bound "because it's cheap" | Below the bound = range failed, stop buying |
| Missing upside beyond H, then chasing | Pulled the grid on the upside breakout, then reluctantly reopened at the highs | Strictly forbidden to reopen a grid outside the original band immediately after a breakout |
| Leveraged grid liquidated | Futures grid meets a wick, position forcibly liquidated | Leverage ≤ 2-3x; never use futures grids on high-volatility instruments |
| Constantly tweaking parameters | Changing spacing/band whenever the grid loses, making things worse | Backtest parameters + test small first; while running only change "pause/stop-loss", never parameters |
| Fee erosion | High frequency, narrow spacing, profits all paid to the exchange | Per-cell spread ≥ 2× round-trip fees |
| Event shock | Grid left running into earnings/CPI, gapped through | Pause grids one day before major events |
8. Grid Launch Checklist
□ Instrument and band: last 1-2 months' range drawn? 5% buffer beyond upper/lower bounds?
□ Market state: ADX < 25? Flat moving averages? — confirmed range market
□ Parameters: cell count and per-cell capital computed? Per-cell spread ≥ 2× round-trip fees?
□ Capital: total grid investment ≤ 50% of capital? Reserve funds beyond the boundary ready?
□ Stop-loss plan: what if price breaks 5% below the bound? (stop/pause) — written down
□ Event calendar: next macro event/earnings date? Should the grid pause?
□ Platform rules: minimum order size, fees, grid trigger mode confirmed?
□ Live testing: ran a complete 2-4 week cycle with small capital?
9. Quick Reference: Common Grid Fallacies
| Fallacy | Reality |
|---|---|
| Grid = guaranteed profit | Grids short volatility and always lose in one-sided markets — it's only a question of "when" |
| Denser spacing earns more | Denser spacing thins per-pair returns, raises fee share, and gets swept by wicks more easily |
| Wider band is safer | Too wide → big gaps between cells, few fills, capital tied up long; too narrow → easier to break |
| The deeper the drop, the more cells to add | Breaking below the bound proves the range judgment wrong; adding cells is fueling the fire |
| "The grid lost because the market was bad" | Market state should have been judged before launching; misjudging it is a strategy problem, not bad luck |
| Bot runs itself, no supervision needed | Events, breakouts, and parameter drift all need human intervention — "set and forget" is the biggest lie about grids |
| Spot grids carry no risk | No liquidation ≠ no loss; a one-sided drop can trap you deeply for years |
⚠️ Risk Warning
Grid trading is not a "guaranteed-profit machine": in one-sided markets it compounds losses until capital runs out, and history offers plenty of cases of grids "earning half a year, losing it all in one month". All ranges, parameters, and rule-of-thumb thresholds here are historical statistics, not predictions; defer to actual market conditions and platform real-time rules. Leveraged grids carry liquidation risk and can wipe out principal or even produce a negative balance; participate only with money you can afford to lose, and fully understand the bot's true parameters and costs before running one.